Integrate with Splunk
In this topic, you will learn how to send Portnox™ Cloud alerts to the Splunk Cloud.
Create a HTTP Event Collector in Splunk Cloud
In this section, you will learn how to add a HTTP Event Collector in Splunk Cloud, so that it can receive data via HTTPS from Portnox™ Cloud.
-
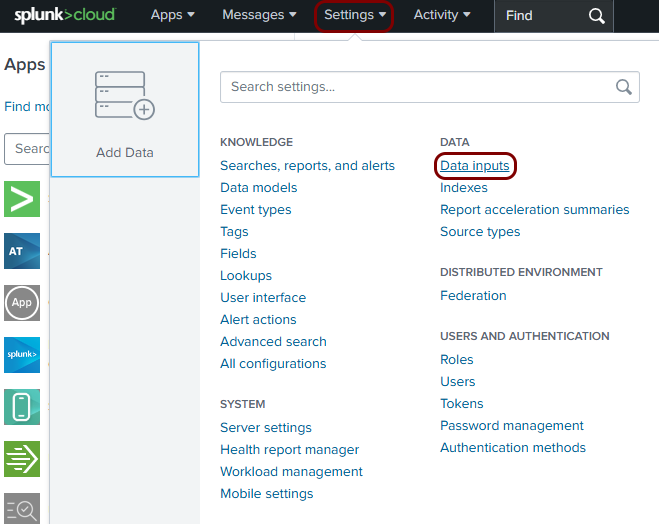
Open your Splunk Cloud dashboard in the browser and select the option.
-
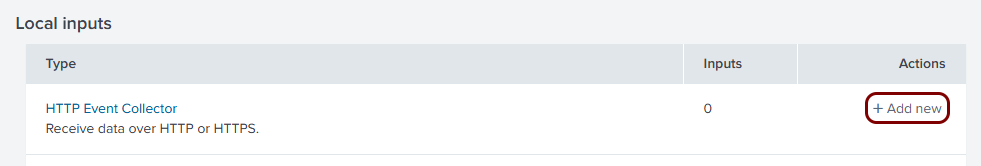
In the Data inputs pane, in the Local inputs table, find the row with
the following Type: HTTP Event Collector, and then click on the
+ Add new link in the Actions column for this row.
-
In the Add Data step, enter a name for the HTTP Event Collector, and then click on the
Next button.
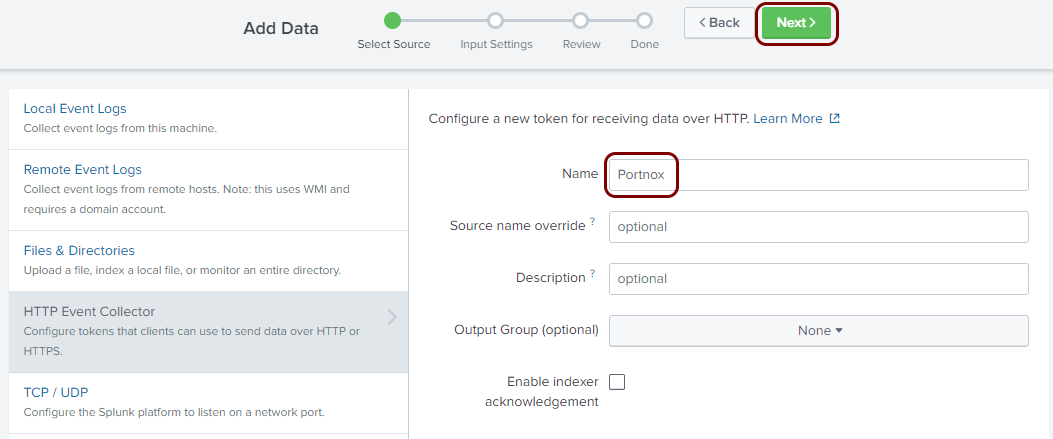
In this example, we used the name Portnox but you can use any name you like.
-
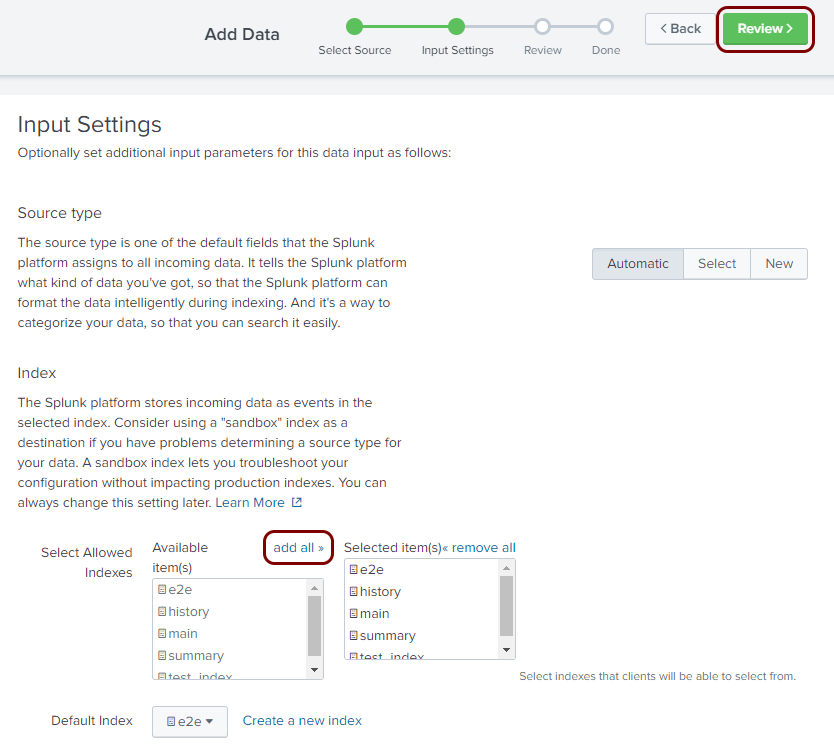
In the Input Settings step of the Add Data wizard, click on the
add all link above the list of available indexes, and then click on the
Review button.
-
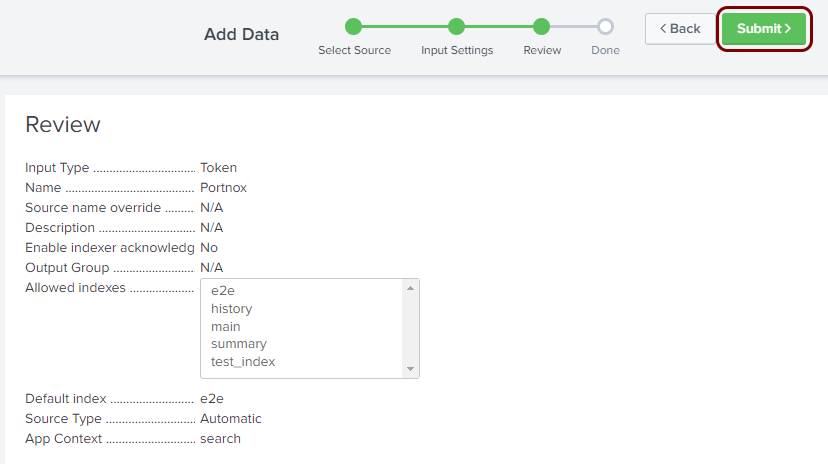
In the Review step of the Add Data wizard, click on the
Submit button.
-
In the Done step of the Add Data wizard, click on the Token
Value field to highlight it, and then copy the value (for example, using
Ctrl+C on Windows).
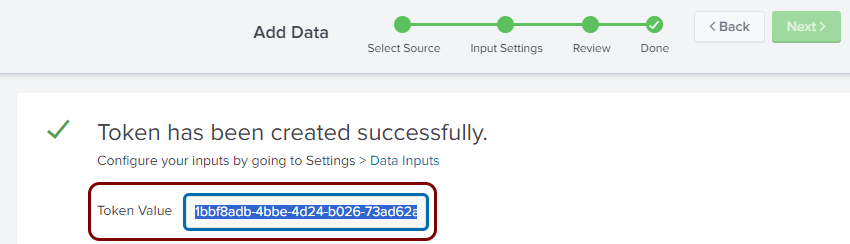
Paste and save the copied value in a text file. You will need this value to configure Portnox Cloud.
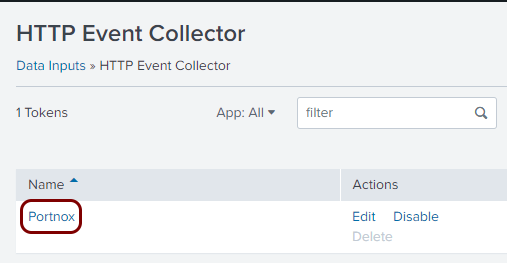
Result: The HTTP Event Collector is active. You can check it here: .
Configure Portnox Cloud
In this section, you will learn how to configure Portnox™ Cloud to send alert data to the Splunk collector.
-
In the Cloud portal top menu, click on the Settings option.

-
In the Cloud portal left-hand menu, click on the option.
-
Create a new SIEM integration with Splunk.
-
In the SIEM integration service section, click on the Add a new SIEM
integration link.
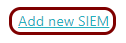
The New SIEM integration section opens.
-
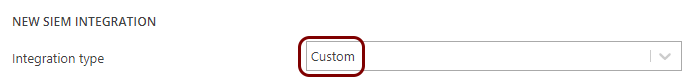
In the Integration type field, select the Custom
option.
-
In the Name field, enter the name for the new integration.

In this example, we used the name Splunk but you can use any name you like.
-
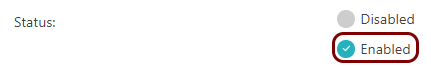
In the Status field, select the Enabled option.
-
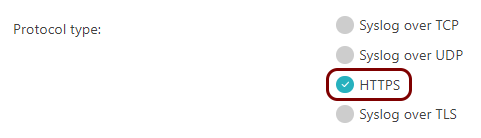
In the Protocol type field, select the HTTPS option.
-
In the Authentication token field, paste the token that you copied earlier when
setting up the Splunk collector.

-
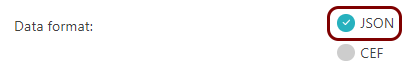
In the Data format field, select the JSON option.
-
Click on the Save button to add the integration.

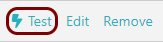
- Optional:
Test the configuration by clicking on the Test button.
-
In the SIEM integration service section, click on the Add a new SIEM
integration link.
- Optional:
To configure the types of alerts sent to your SIEM solution, see the following topic: Portnox Cloud alerts.
Note:To learn more about the content and format of alert messages sent to SIEM solutions, see the following topic: Format and content of alert information for SIEM.
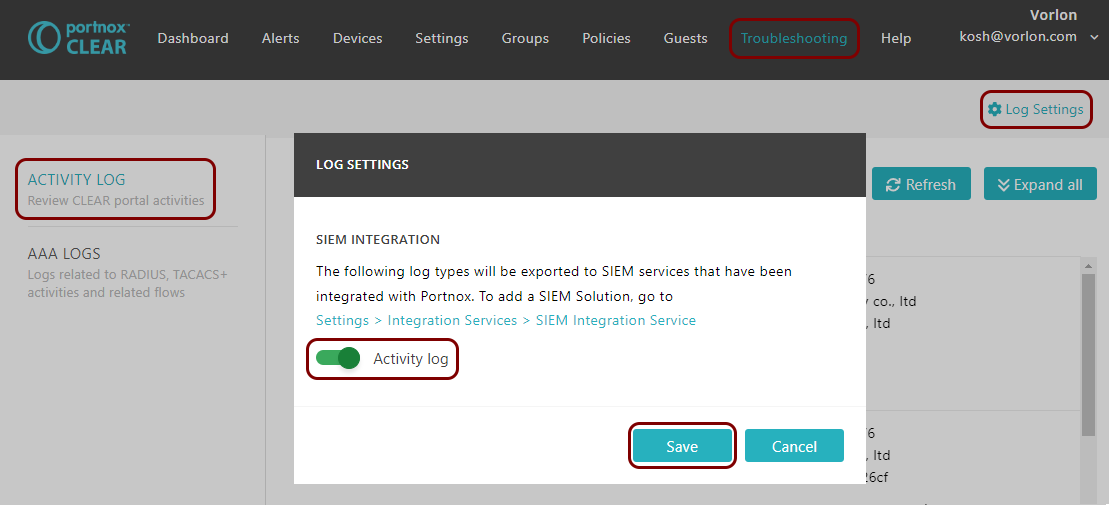
You can also send all of the Portnox Cloud activity log (activities performed by administrators in Portnox Cloud) to your SIEM solution. To do this, go to , activate the Activity log switch, and click on the Save button.
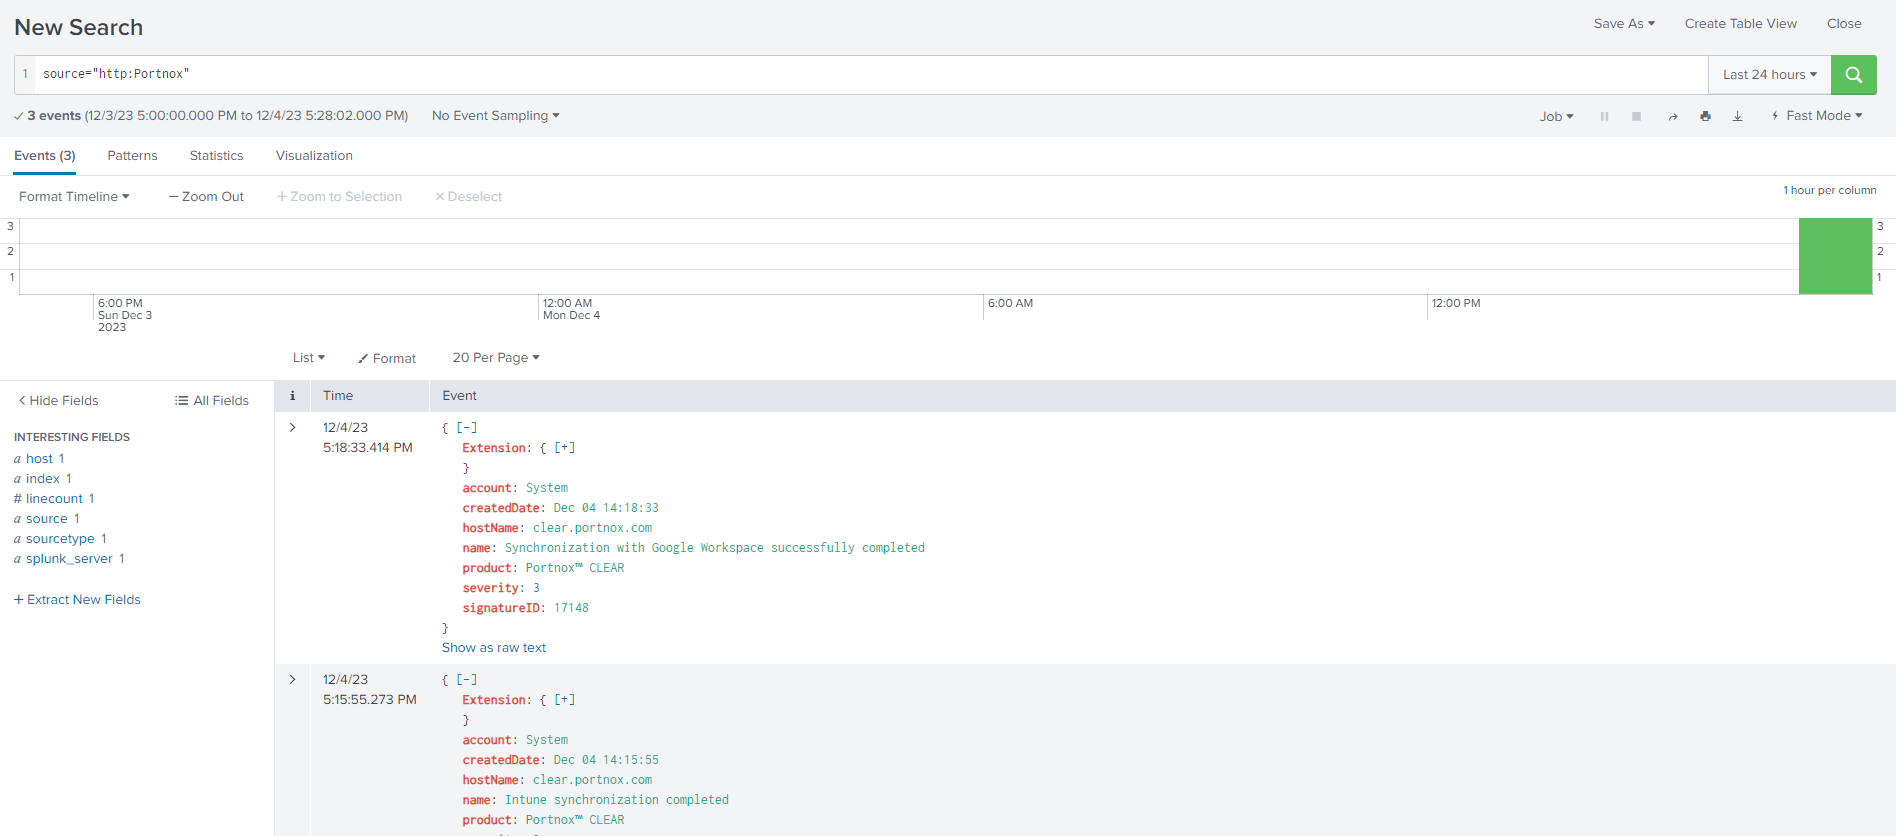
Result: Splunk is receiving alerts from Portnox Cloud.
You can confirm the integration, for example, by running a query
source="http:collector_name" where collector_name
is the name that you used for the HTTP Event Collector.